
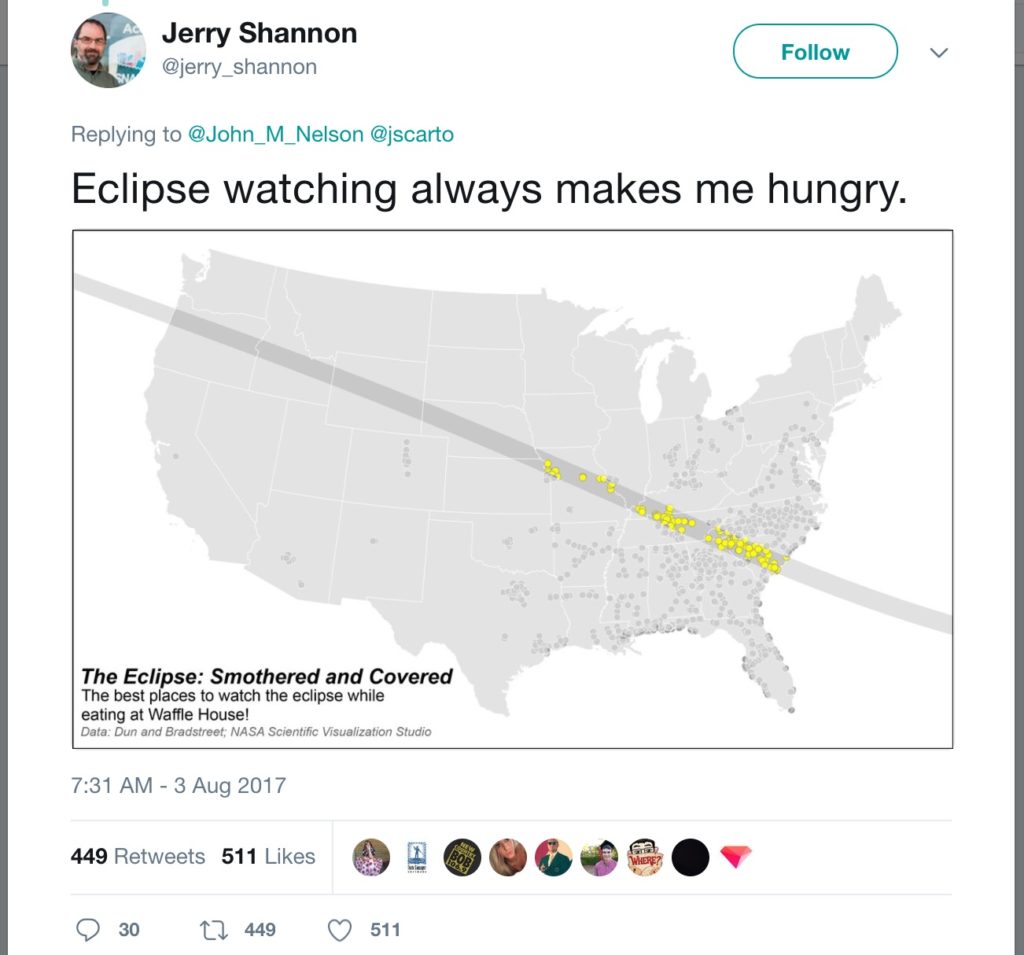
When you think about content going viral, maps don’t typically come to mind, but “The Eclipse: Smothered and Covered,” a map with the 2017 eclipse path of totality overlaid with the best Waffle House locations for viewing, did just that. The map was created by University of Georgia assistant professor of geography Jerry Shannon. After being retweeted by Waffle House, Shannon’s map quickly went viral. Almost 200,000 people viewed the tweet, and several news outlets picked it up.
 Understanding more about viral content can help researchers better determine how people can bond over topics that are controversial as well as humorous.
“As geographers develop ways to connect with the broader public over pressing issues such as racial segregation and climate change, we can work in social media and online communities to build trust, forge new partnerships and foster productive conversations,” said Shannon.
Another viral map was created by Texas Christian University assistant professor of geography Kyle Walker. His interactive dot-density map titled “Educational Attainment in America” allowed people to zoom and pan around the United States to see educational trends. Over 150,000 people visited the map, and several news outlets picked it up, including Business Insider.
In a paper published in The Professional Geographer, Shannon and Walker used these two maps to analyze the factors that contributed to the viral phenomena. Though they focused on viral cartography, their results can be applied to viral content of all types.
“Social media makes it increasingly easy to create and share all kinds of content, including maps,” Shannon said. “As scientists and communicators, it’s crucial that we understand the factors that make our work go viral.”
Shannon and Walker focused on three aspects that contributed to the virality of their maps. First, maps act as a form of phatic communication or small talk, which reaffirms social ties and shared group identities. Shannon’s Waffle House map demonstrated a distinctive tie to the Southeast, where he lives and works. People’s sense of connection to Waffle House fueled the popularity of this map. Some people visited the Waffle House locations to watch the eclipse and posted pictures that showed the viral spread of this map.
Walker’s education map also drew on identification with specific locations. News coverage used his map to identify the quality of education in local neighborhoods, and the map formed or reinforced perceptions of these neighborhoods.
“It’s a misconception that maps only show what’s there,” Shannon said. “These maps also create perceptions of neighborhoods and regions that can shape people’s future actions, from where they watch an eclipse to where they buy a house.”
Second, viewers engage maps from specific places and times. The Waffle House map drew responses based on the readers’ relationship to the Southeast where Waffle House is prominent. Interest in this map was also high in the days leading up to the eclipse in 2017, and finding the right moment is key for viral content.
Third, the academic expertise and authority was important to users of the maps, who expected accuracy from university researchers.
While the mapmakers focused on the general trends presented in the maps, readers were more likely to hone in on the specifics and how the maps relate to them individually.
“We focused on the broader geographic patterns revealed by the maps, clusters of restaurants or neighborhood residents,” Shannon said. “In contrast, lay readers focused on specific points, locating themselves on the map or identifying locations they hoped to visit.”
The paper is available at: https://www.tandfonline.com/doi/full/10.1080/00330124.2019.165377